Improving Spatial Audio Quality with Motion-to-Sound Latency Measurement
Improving Spatial Audio Quality with Motion-to-Sound Latency Measurement
(Writer: James Seo)
[Introduction: Synopsis]
Spatial Audio is an audio rendering technology that reproduces sound according to the user's position and direction when listening through headphones or earphones, creating the illusion of a natural and lifelike sound experience. The quality and performance of Spatial Audio depend not only on the rendering of spatial and directional characteristics but also on the time it takes for the sound to be rendered and played back based on the user's movement (Motion-to-Sound Latency).
- If the Motion-to-Sound Latency is too long, users may lose immersion and even experience motion sickness due to the discrepancy between the visual stimuli and auditory experience. This is the same concept as motion-to-photon latency, which causes motion sickness when using VR devices.
Measuring Motion-to-Sound Latency is essential for evaluating the user’s spatial audio experience. However, this measurement is not a simple task. The overall Motion-to-Sound Latency can be divided into several parts, as shown in Figure 1: (1) motion-to-sensor latency, which detects the user's motion, (2) sensor-to-processor latency, where the detected movement is transmitted from the sensor to the audio processor, (3) rendering latency occurring during the rendering process in the processor, and (4) communication latency that occurs when the rendered signal is transmitted through communication channels such as Bluetooth. Measuring these components independently is not easy, especially for finished products on the market, as it is impossible to break down each module inside for measurement.
In this article, we will explain a method for more accurately measuring Motion-to-Sound Latency. The content is not too difficult, so we believe you can follow along and understand it well.
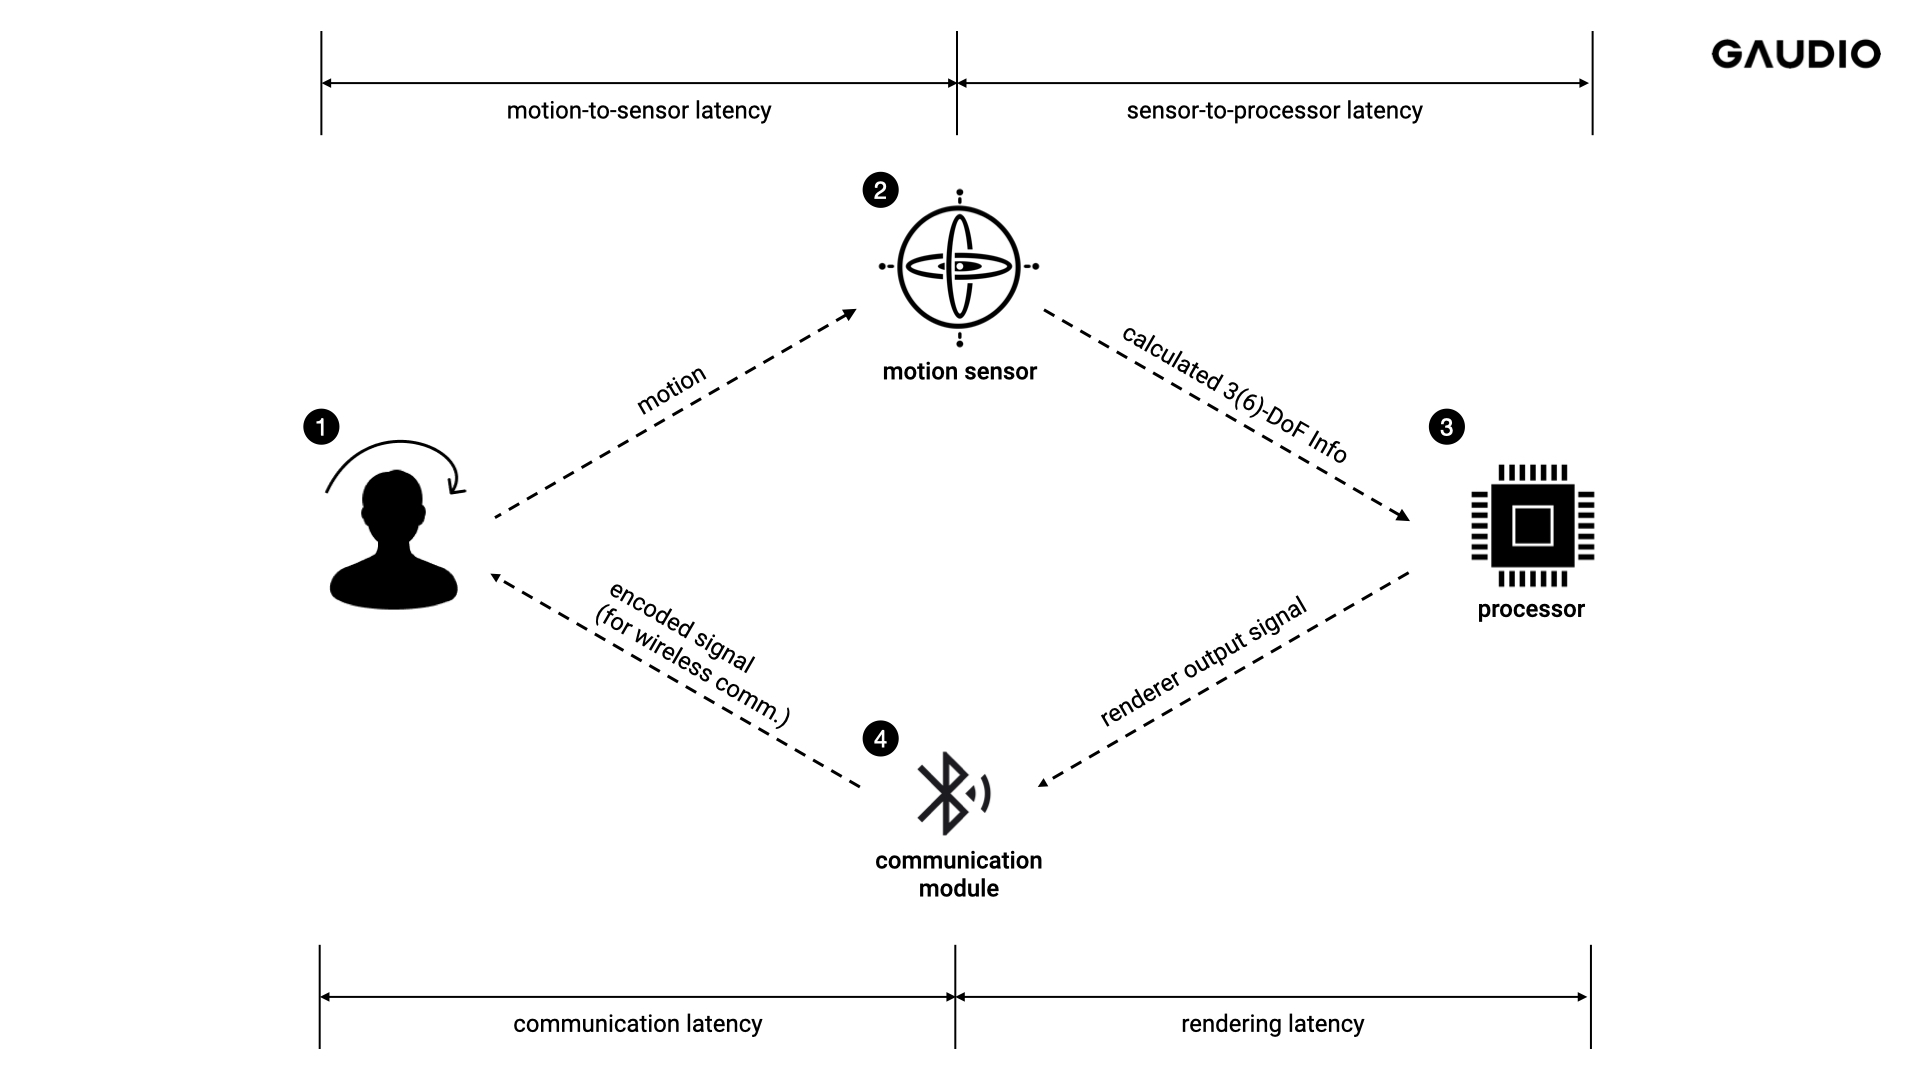
Figure 1 Breakdown of Motion-to-Sound Latency
[Measurement Hypothesis: Binaural Rendering & Crosstalk Cancellation]
As mentioned earlier, Spatial Audio utilizes Binaural Rendering technology to render sound sources in a space according to the relative position of the sound source and the listener. In other words, it is a technology that aims to reproduce not only the position of the sound source but also the feeling of the space in which it exists.
Generally, Binaural Rendering is performed using Binaural Filters such as BRIRs (Binaural Room Impulse Responses) and HRIRs (Head-Related Impulse Responses).
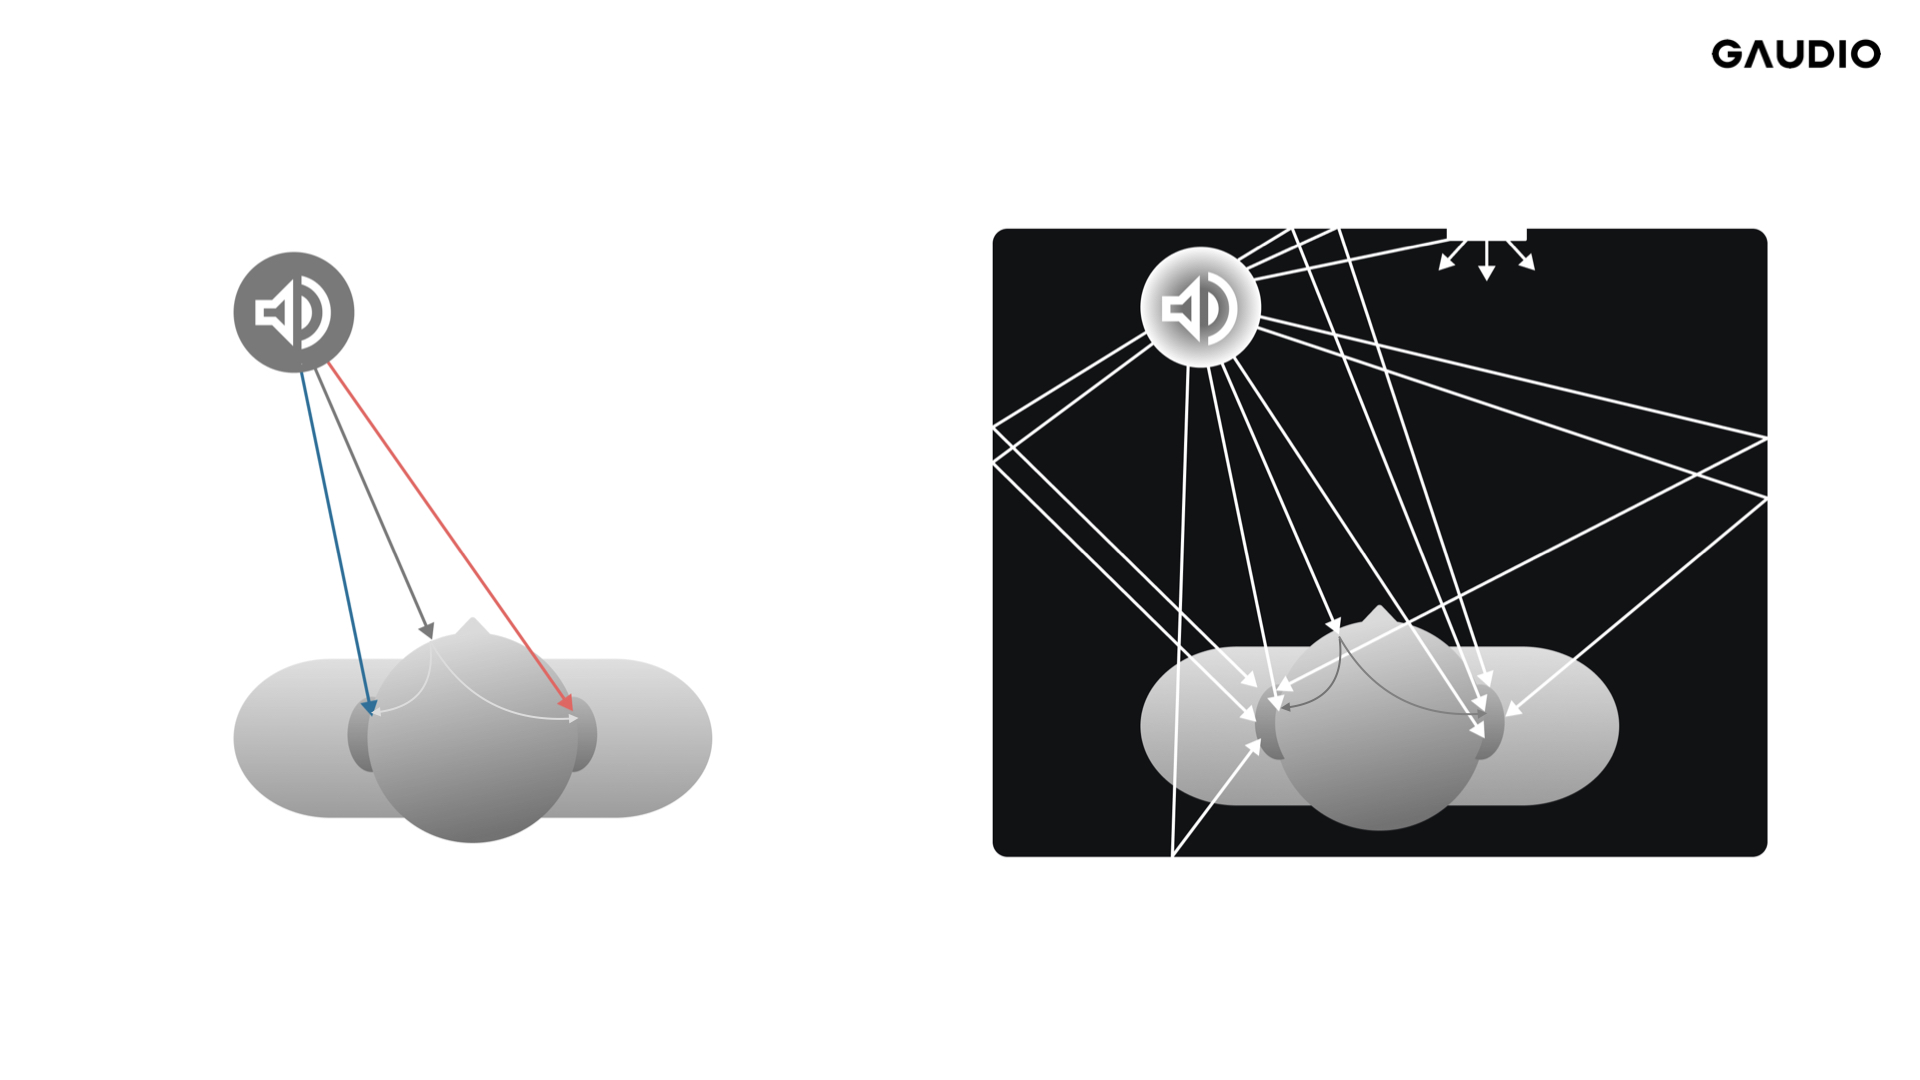
Figure 2 HRIR(Left) vs. BRIR(Right)
(HRIR: The relationship between the listener and a sound source that doesn’t contain listening room characteristics)
(BRIR: The relationship between the listener and a sound source that contains listening room characteristics)
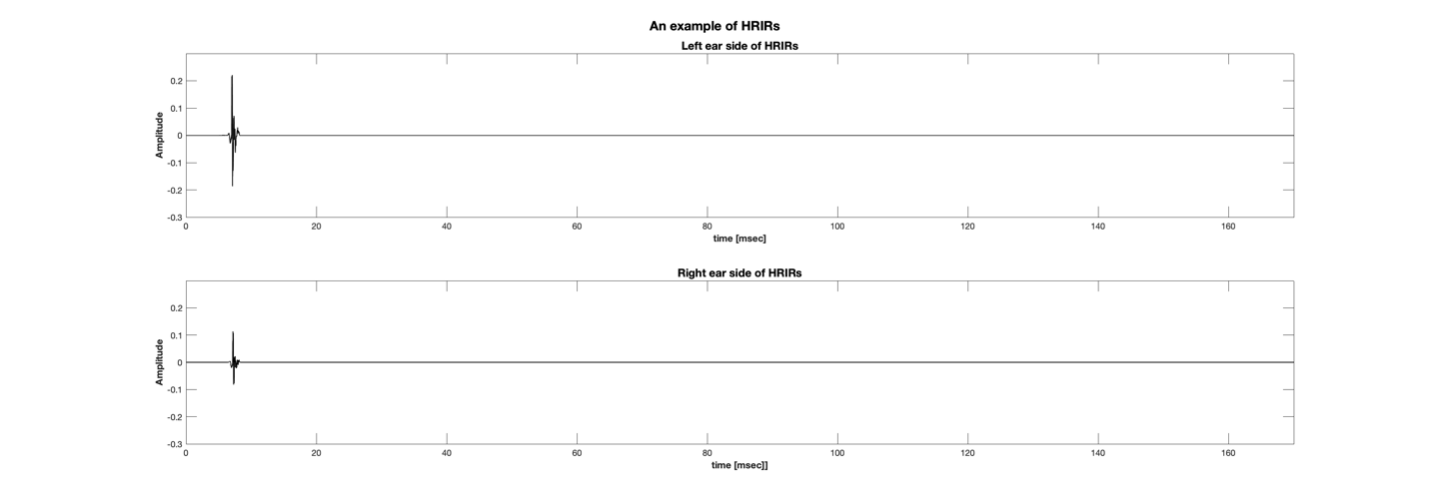
The basic concept of a Binaural Filter is a filter that defines the characteristic changes of sound coming from a specific 'position' to the left and right ears. Therefore, this Binaural Filter can be defined as a function of distance, horizontal angle, and vertical angle. The definition of the Binaural Filter may vary depending on whether it reflects spatial characteristics due to reflected sound components (BRIR) or only represents the relationship between the sound source and the user's ears (HRIR). In the case of BRIR, both direct and reflected sounds are represented in the form of a Binaural Filter, while HRIR is a Binaural Filter that considers only direct sound, excluding reflected sound. Naturally, BRIR has a much longer response length than HRIR.
Typically, Spatial Audio uses BRIR rather than HRIR, so in this article, we will explain based on BRIR.
(a)
(b)
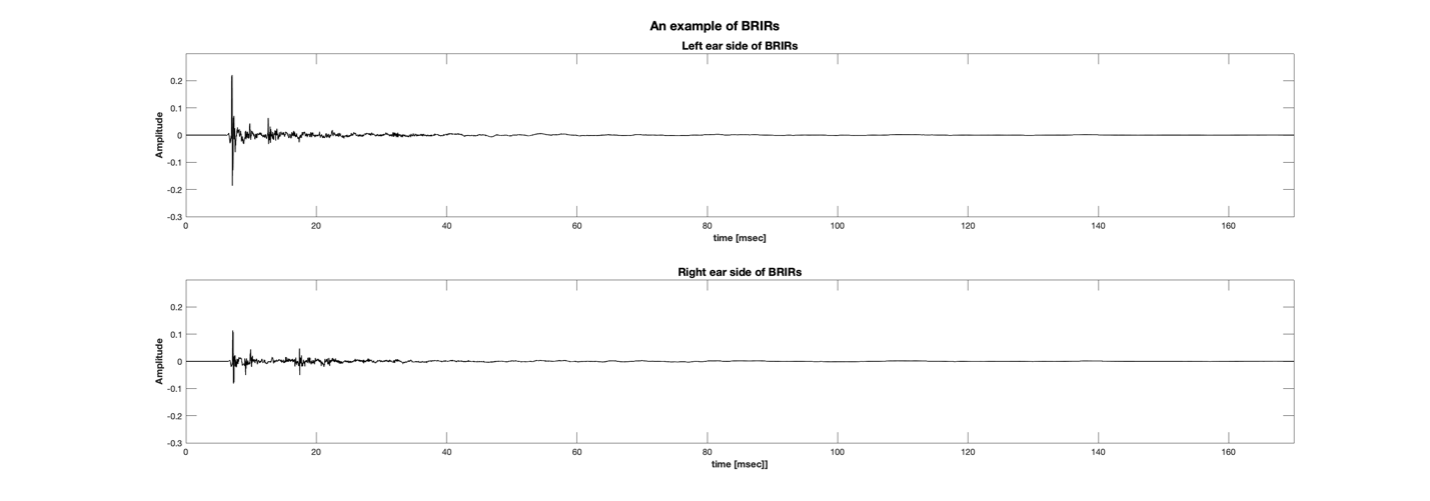
Figure 3 An Example of Impulse Responses of (a) HRIR and (b) BRIR
First, you need to determine two virtual sound source positions. It is better to choose two points that belong to different sides based on the median plane (the plane that divides left and right equally; in this context, it means the plane dividing left and right with the user at the center). The reason is that this measurement method uses the crosstalk cancellation phenomenon.
(You may be wondering what crosstalk cancellation phenomenon is. Well, you will naturally learn about it as you finish reading this article!)

Figure 4 An example of virtual speakers positions for M2S measurement
Once the positions of the two virtual sound sources, which are on different sides of the median plane as shown in Figure 4, are determined, you can measure two sets of transfer functions, or BRIRs, from each sound source to both ears. These sets are represented as [BRIR_LL, BRIR_LR] and [BRIR_RL, BRIR_RR]. In each set, the first letter after '_' indicates the position of the sound source (left or right), and the second letter indicates the position of the ear (left ear or right ear). So, BRIR_LL refers to the impulse response from the left speaker propagating through space and reaching the left ear, right?
With these BRIR sets, you can calculate the magnitude difference and phase difference between the Ipsilateral Ear Input Signal (the signal transmitted from the same side sound source) and the Contralateral Ear Input Signal (the signal transmitted from the opposite side sound source) for any single-frequency signal. In simpler terms, you can calculate the magnitude difference and phase difference between the sound played from the left speaker to the left ear and the sound played from the right speaker to the left ear.
By calculating the magnitude difference and phase difference of these Ipsilateral Ear Input Signals and Contralateral Ear Input Signals for a specific frequency and using them in the form of an inverse function to modify the signal of the right virtual sound source, you can either completely eliminate the sound in the left ear due to crosstalk or play a much smaller sound compared to the right. It creates a barely audible sound. This magnitude difference and phase difference can be calculated from the magnitude response and phase response of BRTF (Binaural Room Transfer Function), which is the frequency domain representation of BRIR, or can be obtained by measuring it using a specific frequency.
For example, the input signals without the magnitude difference and phase difference are as follows:
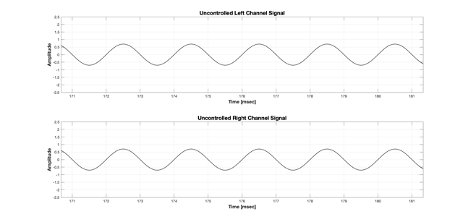
Figure 5 Uncontrolled input signal for left and right virtual speakers
In the above Figure 5, the top is the input signal of the left channel among the virtual channels, and the bottom is the input signal of the right channel among the virtual channels. They are completely identical signals. However, what if you calculate the magnitude difference and phase difference for a specific frequency from BRIR to the left ear from the left channel and the right channel, and change the magnitude and phase of the right virtual channel signal so that the final left ear input signal is offset? The input signals would then look like Figure 6.
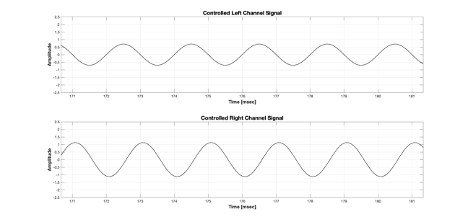
Figure 6 Controlled input signal for left and right virtual speakers
Now, what would the input signal to the left ear be when played with an input like Figure 6?
The results are shown in Figure 7.
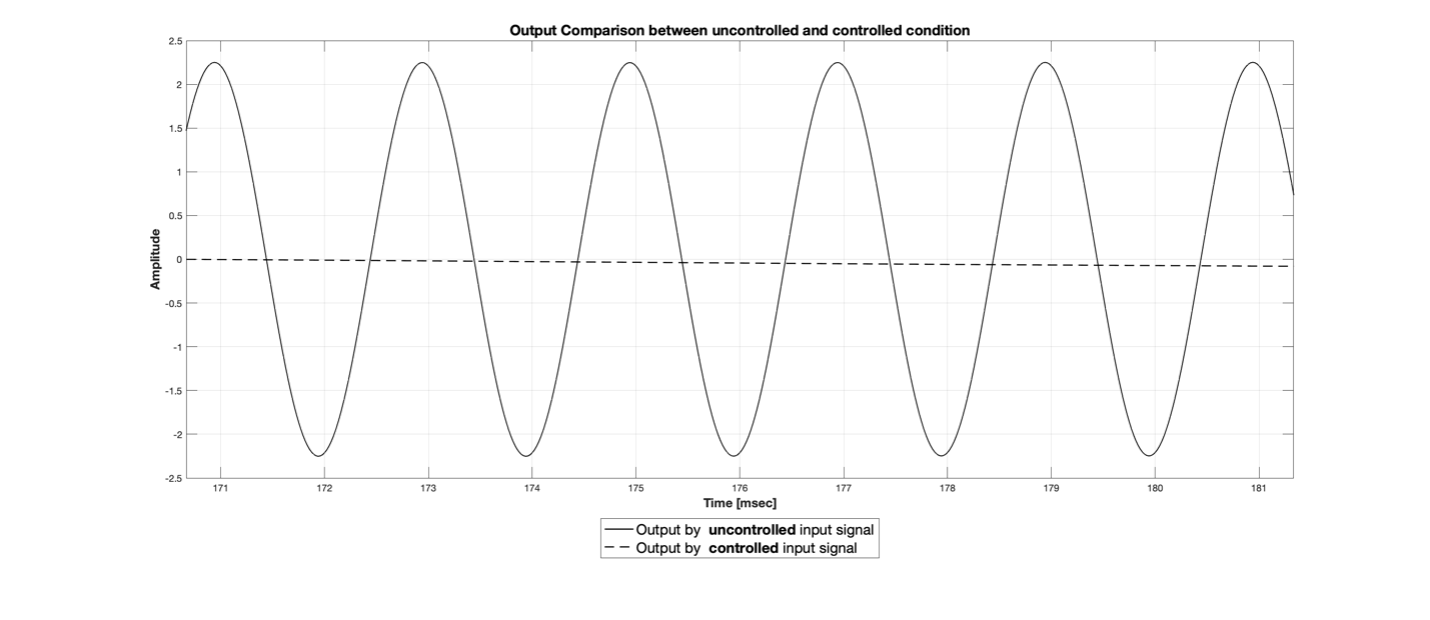
Figure 7 An example of left ear input signal for uncontrolled and controlled input signal
In Figure 7, the solid line represents the left ear input signal when rendering the same signal to both virtual channels without adjusting the magnitude/phase difference, while the dotted line represents the left ear input signal when the adjusted magnitude and phase difference are applied to the right virtual channel signal. You can clearly see the reduced magnitude. This method is called "crosstalk cancellation." It involves adjusting the magnitude/phase difference skillfully so that the sounds transmitted from the ipsilateral and contralateral sides cancel each other out. Crosstalk cancellation occurs when the magnitude and phase differences are perfectly aligned, and if either of them does not meet the conditions, the output signal may even become larger.
When rendering an input signal like in Figure 6 and looking straight ahead, the signal entering the left ear will either not be heard or will be heard as a very faint sound. Since the BRIR has a tail-forming filter corresponding to the rear reverb, there may be some actual errors even if the exact magnitude/phase difference is calculated. However, I can say that the sound produced at this time has the smallest magnitude.
[Measurement Method & Results]
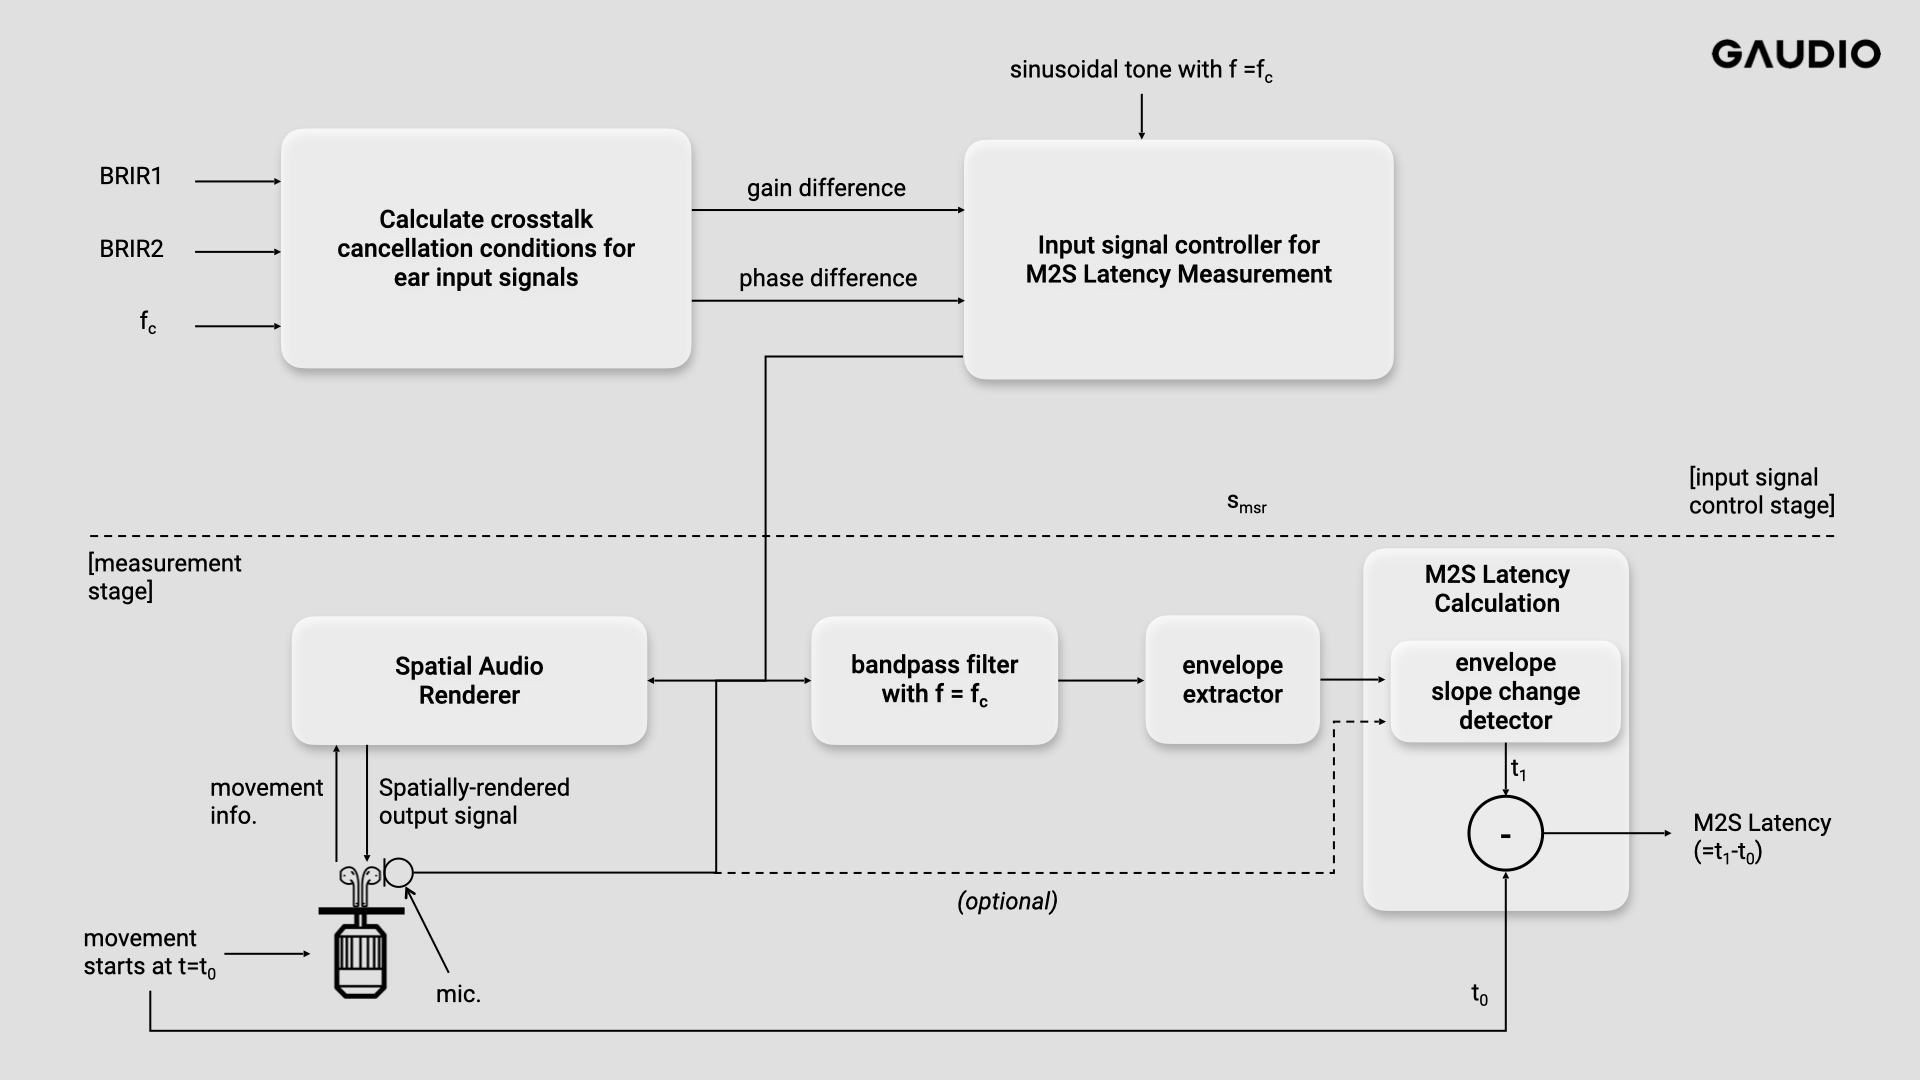
Figure 8 Block diagram for M2S measurement
Figure 8 shows the process of measuring M2S (Motion-to-Sound) Latency. The earlier explanation was about how to generate input signals for measuring M2S Latency and corresponds to the [input signal control stage] in the figure above. The generated signal is smsr. Now, let's actually measure the M2S Latency. The input signal smsr is fed into the Spatial Audio Renderer, which receives information about movement from a device such as TWS (True Wireless Stereo) or another IMU-equipped device and performs spatial audio rendering accordingly.
First, we assume that the TWS detects the user's movement and sends the information. In the absence of user movement, the input signals to the left or right ears of the binaural output signal are either silent or playing a relatively very quiet sound due to crosstalk cancellation. When you rotate the TWS using a motor or similar at t=t0, the TWS detects the movement (in reality, the user's movement) and sends the corresponding movement information to the Spatial Audio Renderer. The Spatial Audio Renderer then renders and generates the output signal accordingly, which is played back through the TWS. When you capture the played sound, you can see the change in the envelope of the rendered signal as the crosstalk cancellation condition breaks, and from that, you can measure the M2S Latency.
However, there may be situations where you cannot directly acquire the output signal of the Spatial Audio Renderer due to environmental constraints. In such cases, you can use an external microphone to record and acquire the signal. There may be the influence of external noise in this case, but if you use a specific frequency, you can remove the noise using a bandpass filter. I'll explain in more detail through the following figure.
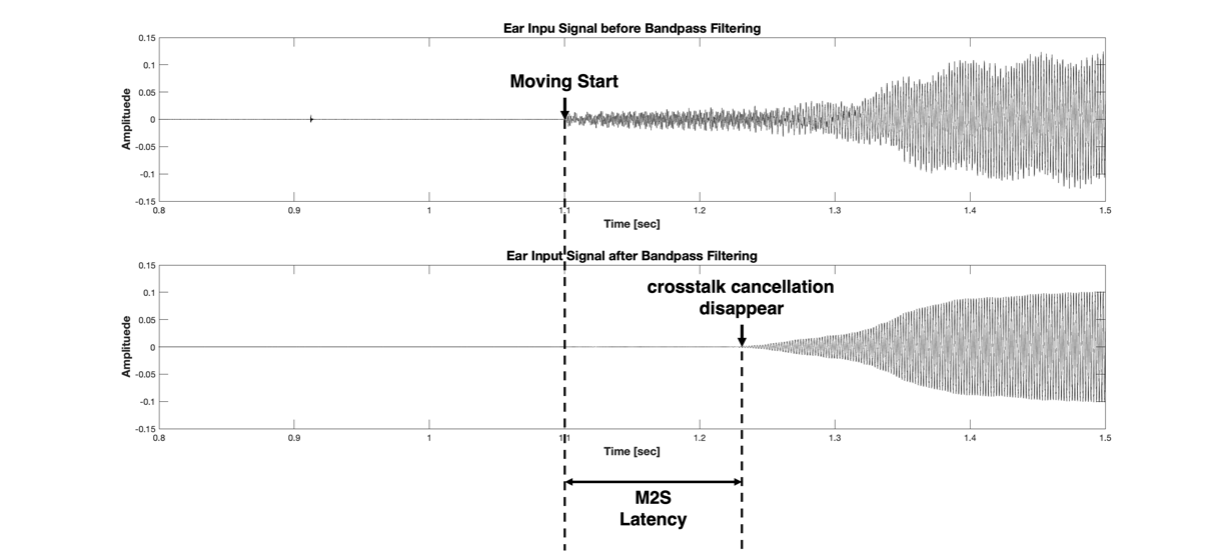
Figure 9 Recorded signal before(upper) and after(lower) bandpass filtering
The top image in Figure 9 is the original measurement signal. The 'Moving Start' in Figure 9 corresponds to t0 in Figure 8. That is, the section marked 'Moving Start' represents the stationary state. In the stationary state, the Ear Input Signal for that direction is almost inaudible due to Crosstalk Cancellation. From the 'Moving Start' moment, the microphone records both the noise of the motor operating and the actual rendering signal; however, in the top image, the rendered signal is small, and the noise is relatively large, making it impossible to know when the crosstalk cancellation disappears. In this experiment, we used a 500 Hz pure tone as the input signal. Thus, we only need to look at the 500 Hz signal, so if we pass the signal in the top column through a bandpass filter with fc=500 Hz, we can cleanly eliminate the motor noise (using the bandpass filter mentioned in the previous paragraph to remove noise). The result is the bottom image in Figure 9. After starting to move and after a certain time, as the crosstalk cancellation condition breaks, you can see the envelope of the recorded signal increase. That is, the point marked as "crosstalk cancellation disappears" corresponds to t1 in Figure 8. Therefore, we can calculate the M2S Latency as t1-t0.
There are various ways to find the point where the envelope increases. You could simply find the section where the recorded signal's sample values increase, but that would be too inaccurate. If perfect cancellation does not occur, the sample values will continue to change even during the cancellation. Instead of using individual sample values, you can divide the recorded signal into sections of a certain length, then calculate the variance of the sample values included in each section. To calculate the envelope's variance, it is essential to select the length of each section. A shorter time interval provides higher time precision in the time domain but must be longer than the input signal frequency's period. That is, the minimum length of each section must be longer than the input signal frequency's period. In the example above, we used a 500 Hz input signal, meaning we need at least a 2ms time interval to obtain the envelope's change. In other words, with a 500 Hz input signal, the maximum precision is 2 ms. If you want higher resolution, you can use a higher frequency input signal. However, be cautious as using too high a frequency input signal may slightly increase the error range for the magnitude/phase difference that can be calculated from the filter. In addition, you can measure the M2S Latency by extracting the sparse envelope from the measured signal, calculating the actual slope of the envelope, and using the point where the slope changes drastically as the basis. Depending on the measurement environment and the recording results, you can selectively change and use this method.
Ultimately, as shown in Figure 9, we can measure the M2S Latency based on the originally recorded signal and the signal bandpass-filtered with fc=500 Hz. This latency includes all latencies occurring in the processes where all related information is exchanged, as shown in the earlier diagram. Therefore, this latency will be the actual latency experienced by the user.
[So when we actually measured the Latency…]
These days, newly released TWS (True Wireless Stereo) devices come equipped with spatial audio features that not only add a sense of space to the sound but also provide rendering functions that respond to users' head movements. As you may know, Gaudio Lab is a company boasting both the original and best technology in the field of spatial audio. To determine how quickly each product can respond to user movements and provide good quality, we measured the M2S (Motion-to-Sound) Latency of TWS devices from various manufacturers. The measurement values are based on the average of at least 10 measurements, and we have also recorded the standard deviation.
Using the measurement method described above, we measured the M2S Latency of various TWS devices, and the example values can be found in Table 1 below.
<Table 1 M2S latencies for different TWS [unit: ms]>
| Apple Airpods Pro[1] | Samsung Galaxy Buds 2 Pro[2] | Gaudio Spatial Audio Mockup[3] |
|
|---|---|---|---|
| Average | 124.2 | 203 | 61.1 |
| Standard deviation | 12.18 | 12.61 | 6.17 |
The results were surprising. Gaudio Lab's technology (even though it is still at the mock-up level) recorded a significantly lower Motion-to-Sound Latency! The reason for this is that Gaudio Lab's Spatial Audio Mock-up is based on the world's best Spatial Audio rendering optimization technology and operates on TWS devices. This eliminates the Bluetooth Communication Latency that is necessary for the smartphone rendering method used by other major TWS producers.
At the beginning of this article, we mentioned that the overall quality of Spatial Audio is determined not only by the sound quality of rendering space and direction characteristics but also by the time it takes for the sound to be reproduced from user movements (Motion-to-Sound Latency).
Through this article, which began by explaining how to measure the Motion-to-Sound Latency that enhances the quality of spatial audio, we were able to confirm that Gaudio Lab's technology records overwhelmingly outstanding figures.
You might be curious about the sound quality since the latency is at the highest level. In the next article, we plan to reveal the sound quality evaluation experiment, which showed surprising results following latency, along with sound samples. So, stay tuned~!
Ah! It's no surprise that Gaudio Lab won two innovation awards at CES 2023! Haha.
------
[1] Measurement based on rendering using an iPhone 11 and AirPods Pro. The actual rendering takes place on the iPhone, resulting in significant delay due to communication latency between the phone and TWS.
[2] Measurement based on rendering using a Galaxy Flip4 and Galaxy Buds 2 Pro. The actual rendering takes place on the Galaxy, resulting in significant delay due to communication latency between the phone and TWS.
[3] Measurement result of the mock-up eliminates communication latency by implementing it on the TWS chipset produced by Gaudio Lab with the iPhone 11. The iPhone is used as a source device, and Spatial Audio Rendering is performed on the TWS.
